Centralized Alert Management Platform

Stop Managing Alerts. Start Resolving Incidents.

AlertOps ingests every signal from every monitoring tool, eliminates noise with OpsIQ Smart Correlation, and routes only what matters to the right engineer.

73% alert noise reduction OpsIQ Smart Correlation collapses alert storms into single incidents
200+ source integrations Datadog, Prometheus, Splunk, CloudWatch, Nagios, and more
Intelligent routing severity-aware, source-aware, and schedule-aware, configured once
Deduplication and suppression flap detection, maintenance windows, and dependency-aware controls
OpsIQ enrichment every routed alert arrives with root cause hint and resolution suggestion

See AlertOps Alert Management Live

Demo personalized to your monitoring stack.

Trusted by enterprise IT, DevOps, and SRE teams worldwide
NHS EnglandDeloitteSecuritas GroupHCA HealthcareABBHoneywellbp
The Problem

Your monitoring tools fire. Your engineers spend 18 minutes figuring out what broke.

Alert noise is not a volume problem. It is a signal quality problem. When every downstream symptom of a single root cause fires as a separate alert, your engineers spend more time triaging than resolving.

01 / Noise

14 Alerts Firing for One Root Cause Is Not Monitoring. It Is Chaos.

Your Datadog, Prometheus, and CloudWatch instances alert independently on every symptom of the same failure. Engineers wake up to a storm and spend 20 minutes reconstructing what actually broke.

02 / Routing

The Right Engineer Gets the Wrong Alert at the Wrong Time

Without intelligent routing, every alert goes to whoever is on-call regardless of expertise, severity, or source. The result is engineers resolving incidents outside their domain while the right SME sleeps.

03 / Tooling

Your Monitoring Stack Has No Coordination Layer

You have Datadog. You have Prometheus. You have CloudWatch. They all fire independently with no shared context. Without a correlation layer, you have detection without intelligence.

Before and After

A monitoring tool alerts. AlertOps routes, correlates, and resolves.

Alert management is not just about receiving signals. It is about transforming raw signal volume into actionable, contextualized incidents that arrive with a resolution path.

What changes with AlertOps
What does the engineer receive?
Without

A raw alert string from one tool. 14 similar strings from two other tools. No correlation. No context.

With AlertOps

One correlated incident with root cause hint, historical match, and suggested fix. Ready at page time.

How is alert volume managed?
Without

Every alert passes through. Maintenance windows require manual configuration. Flapping alerts page repeatedly.

With AlertOps

Deduplication, suppression, flap detection, and maintenance window controls. Engineers see what matters.

What happens if nobody responds?
Without

The alert ages out or sits in a queue. MTTR climbs. The issue compounds.

With AlertOps

Automated escalation fires through every configured channel until the incident has an owner.

Platform Capabilities

Every alert management capability. One platform.

AlertOps centralizes signal ingestion, correlation, routing, and escalation in a single system. 200+ integrations. No context switching.

01 / Correlate

One Incident From 14 Alerts. Every Time.

Your Datadog, Prometheus, and CloudWatch instances are firing independently on every symptom of the same failure. AlertOps ingests every signal, normalizes it, and runs OpsIQ Smart Correlation so your engineers see one actionable incident instead of 14 screaming alerts from three different tools.

  • Cross-tool correlation across all 200+ monitoring and observability sources
  • 73% alert noise reduction engineers respond to incidents, not storms
  • Deduplication, suppression, flap detection, and maintenance window controls
73%alert noise eliminated. Engineers respond to incidents, not alert storms.
02 / Route

The Right Alert Reaches the Right Engineer Before the Second Symptom Fires

Intelligent routing means a SEV-1 from Datadog at 2am reaches the right SRE via voice call, not a Slack message they will see at 9am. AlertOps routing logic is severity-aware, source-aware, and schedule-aware configured once, runs forever.

  • Severity-based, source-based, and schedule-aware routing with no manual rule maintenance
  • API-first and webhook-ready for any monitoring source not natively integrated
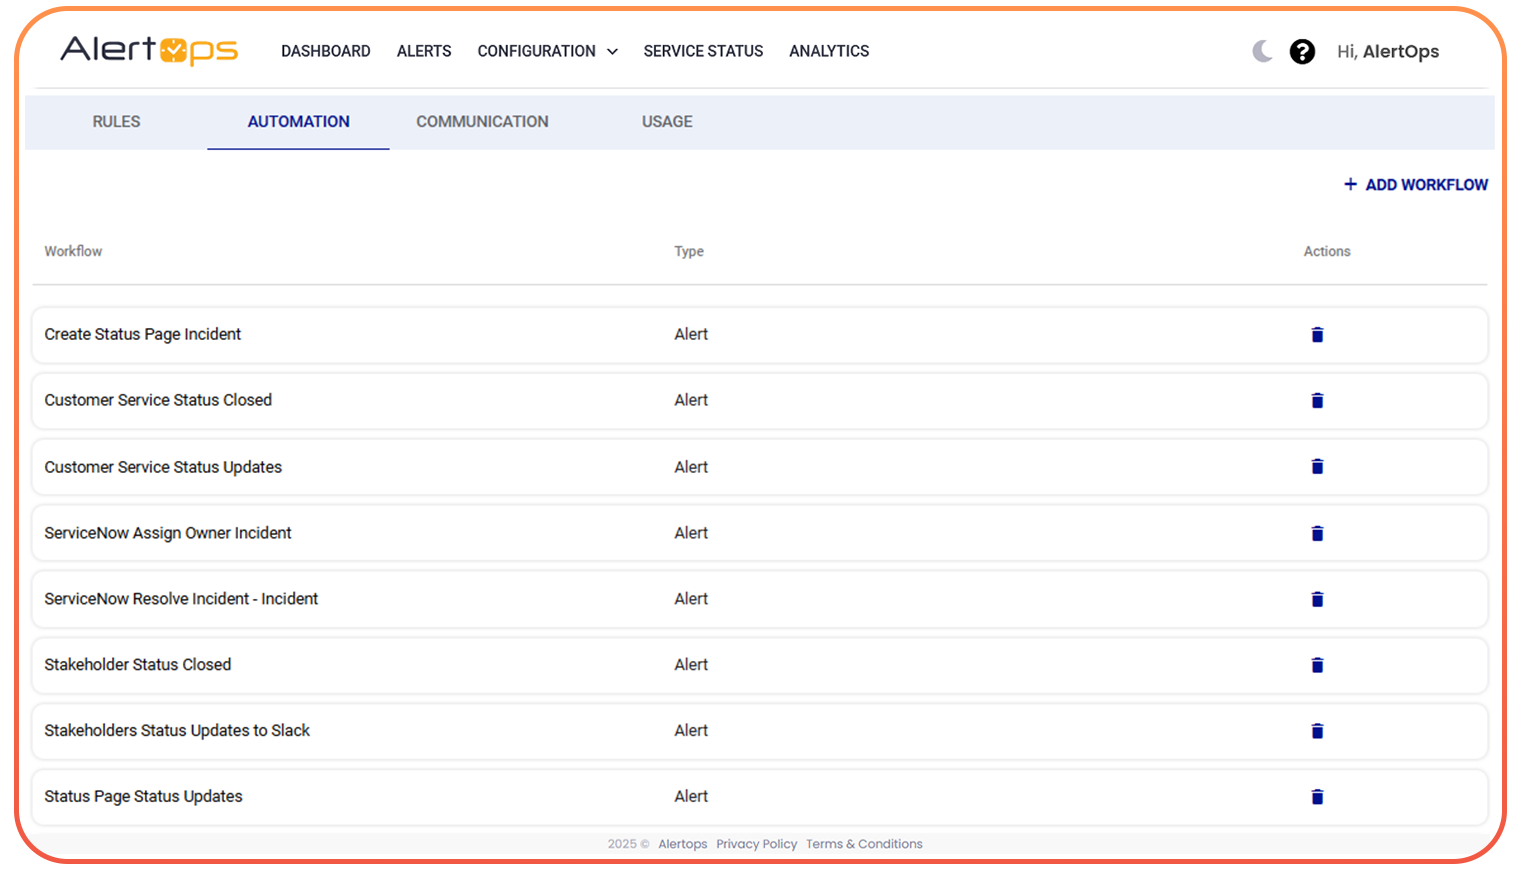
  • Alert workflow automation: define once, AlertOps runs it for every matching signal
AlertOps alert workflow automation and routing rules interface
03 / Notify

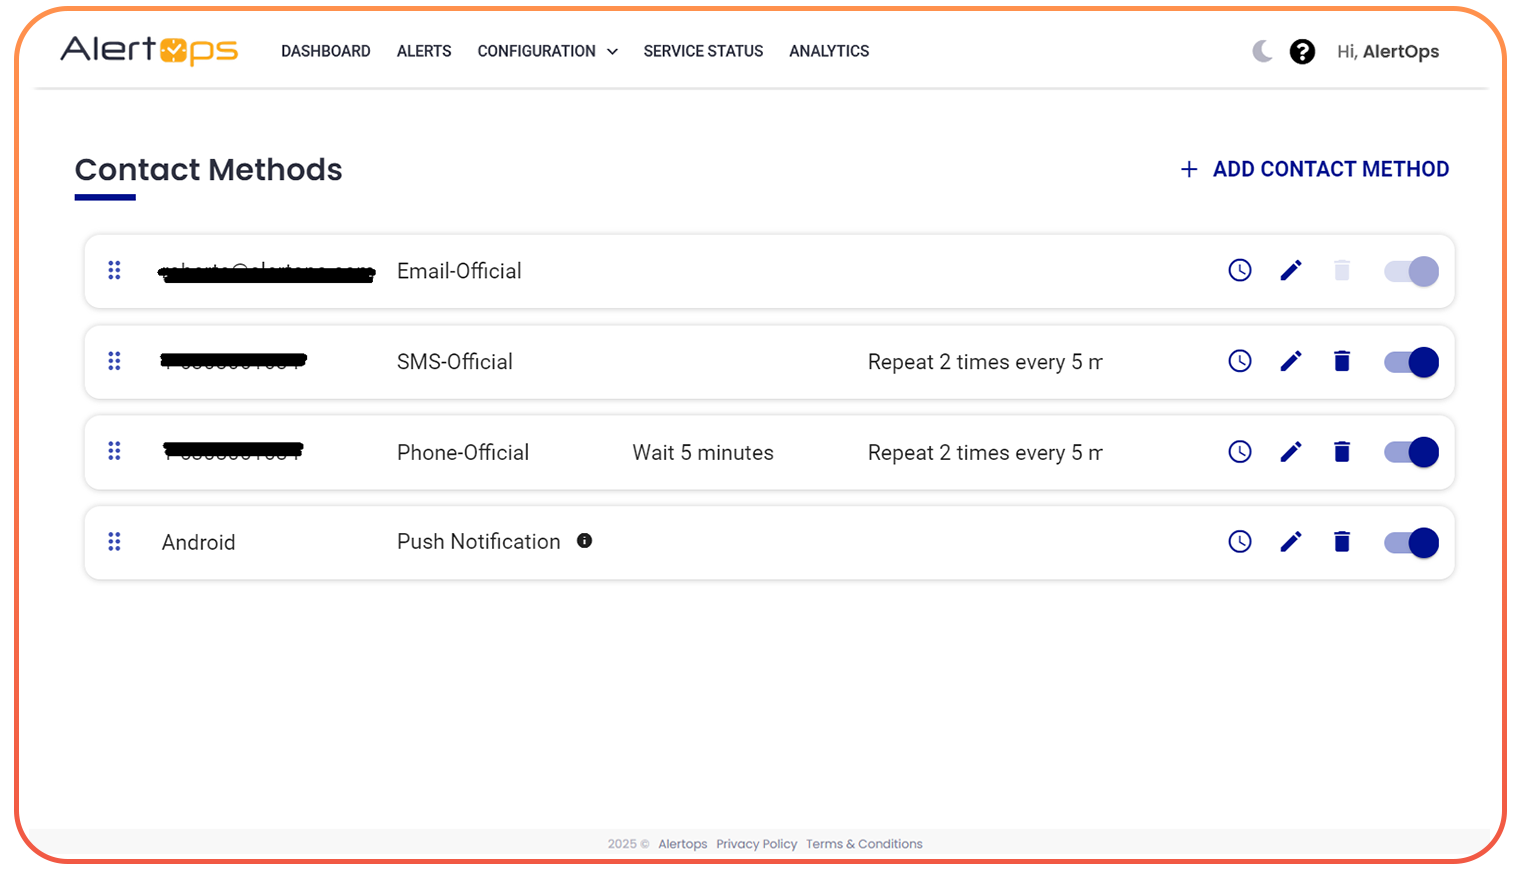
Every Engineer Reached Via the Channel That Actually Gets Their Attention

A P1 needs a phone call. A warning can go to Slack. AlertOps delivers the right alert through the right channel with the right content OpsIQ-enriched context so engineers arrive informed and ready to resolve.

  • Voice, SMS, push, email, Slack, and Teams configured per severity and role
  • OpsIQ enriches every alert with root cause hint, historical match, and resolution suggestion
  • Automated escalation until acknowledged no alert ever has no owner
AlertOps multi-channel alert delivery showing SMS, voice, email, Slack and Teams
* OpsIQ AI Engine

The AI that understands your alert patterns, not just forwards them

OpsIQ does not just pass alerts through a routing table. It understands them, groups them, enriches them with context, and routes only the signals that genuinely need a human with the resolution path already mapped out.

  • Smart Correlation groups related alerts from multiple sources into one actionable incident
  • Intellifield Reasoning enriches every alert with contextual data before routing to the responder
  • Historical Insights detect recurring patterns and surface known resolution paths
  • Resolution Suggestions recommend the proven fix at the moment of escalation
  • Agent Bond connects OpsIQ actions to existing runbooks and automation pipelines
  • Chronicle Postmortems auto-generate from incident data no manual write-up
73%
Alert noise reduced
14 min
Saved per incident vs manual triage
200+
Source integrations
Alert Stream / OpsIQ Correlation Active
!
CPU 97% prod-api-cluster
Datadog SEV-1
Correlated
~
Lambda errors +340% order-fn
CloudWatch
Correlated
~
P99 latency 8.1s checkout service
Prometheus
Correlated
-
CPU warn dev-01 (unrelated)
Grafana
Suppressed
* OpsIQ Smart Correlation

4 alerts collapsed to 1 incident. Root: DB connection pool on rds-prod-01. 1 unrelated alert suppressed. Routed to Sarah K. (SRE Primary). Time saved vs manual triage: approx. 14 minutes.

Before and After

14 alerts fire at 2am. Same event. 18 minutes vs 4 minutes.

The difference between a 4-minute resolution and an 18-minute one is not engineer skill. It is whether the alert management layer does the triage work before anyone is paged.

Without AlertOps

Current State
X

14 alerts from 3 tools hit simultaneously

Datadog, CloudWatch, and Prometheus all fire independently. No correlation. Engineer wakes up to a storm with no context.

X

18 minutes of manual triage

Engineer pieces together the incident manually. Root cause still unclear. Nothing is fixed. MTTR clock is running.

X

Wrong engineer gets the alert

Routing is based on the on-call schedule, not expertise. Right SME is not paged. Handoff required.

X

40+ minute MTTR. No audit trail.

Resolution eventually happens. No timestamped record. Same incident next week.

With AlertOps + OpsIQ

AlertOps
+

4 alerts correlated to 1 incident

OpsIQ groups signals from Datadog, CloudWatch, and Prometheus. 1 unrelated alert suppressed. One incident. One resolution path.

+

Engineer arrives with root cause and fix

OpsIQ delivers correlated incident, root cause hint, historical match, and suggested runbook. Triage work done before the page fires.

+

Right engineer routed via right channel

Severity-aware, source-aware, and role-aware routing reaches the correct SRE via voice call in under 90 seconds.

+

4m 22s MTTR. Full audit trail.

Resolution confirmed. Every action timestamped. Chronicle Postmortem auto-generated. Next time is even faster.

Results

What alert-overloaded teams report after switching to AlertOps

73%
Alert Noise Reduced
OpsIQ Smart Correlation eliminates duplicates and low-priority signals before they reach engineers.
4.2x
Faster MTTA
Intelligent routing reaches the right engineer in under 90 seconds.
60%
Lower MTTR
Enriched alerts and Resolution Suggestions cut time-to-fix from the first incident.
200+
Integrations
One platform replaces fragmented alert tool sprawl across your monitoring stack.
Integrations

Connects to every tool in your stack. No rip-and-replace.

AlertOps plugs into your existing monitoring, ITSM, and ChatOps stack. Replace only the incident layer. Keep everything else exactly where it is.

Datadog
Prometheus
ServiceNow
Jira / JSM
Splunk
New Relic
Slack
MS Teams
CloudWatch
Grafana
Nagios / Zabbix
Dynatrace
ConnectWise
Opsgenie
200+ more
Bi-directional ServiceNow and Jira sync. No-code Open API. Webhook-ready for any source.
View all integrations
Customer Stories

Alert management teams that trust AlertOps

We were running Datadog, Prometheus, and Nagios all firing independently. AlertOps consolidated everything into one stream and OpsIQ correlation cut our alert volume by 70%. Our NOC team can actually keep up now.
Jason K.Director of SRE, Global SaaS Platform
The alert deduplication and suppression alone was worth switching. We were getting 800 alerts a day. Now we get 200, and every single one matters.
Tara N.Head of Platform Engineering, Series C SaaS
We manage monitoring for 14 client environments. AlertOps handles all inbound alert routing across every stack from a single console. It is the only platform that scales to what an MSP actually needs.
David L.CTO, Managed Services Provider
Get Started

Your monitoring stack deserves a smarter alert layer.

AlertOps connects to your existing tools in hours. OpsIQ AI starts reducing noise immediately. No rip-and-replace. No long deployment cycles. 14-day free trial on every plan.